Process Control, Monitoring, and Quality Assurance in Induction Heating: Reducing Risk Without Cutting Every Part
10 min
- Control vs. Monitoring: Separate the Roles
- Heat Treating vs. Mass Heating: Different QA Goals
- Monitor Intermediate Variables That Control Outcomes
- Acceptance Logic: Windows Beat Single Thresholds
- Signature Monitoring: The Most Practical Bridge Between Physics and QA
- Designing Operator-Facing Monitoring That Gets Used
- A Minimal CTQ Set That Still Works
- Designing a Reaction Plan: Monitoring Without Action Is Just Data
- Making Logs Useful: Identifiers and Context
- A Roadmap for Scaling Monitoring
- Extending Monitoring Beyond the Power Supply
- Balancing False Rejects vs. Escapes
- Using Monitoring to Reduce Destructive Testing (Responsibly)
- Why Process Control Must Reflect Process Type
- Where Monitoring Adds the Most Value: Containment and Traceability
- FAQ about Induction Heating Process Control and Monitoring
Key Takeaways
Separate control from monitoring: A control system executes the recipe; a monitoring system independently verifies what actually happened. Independence turns logs into evidence.
Monitor intermediate variables: You can't measure fatigue strength inline, but you can measure delivered kW, frequency stability, position, and quench variables—then compare each cycle to a validated "good envelope."
Signature monitoring beats single thresholds: Time-series signatures capture ramps, holds, and transients that correlate with quality outcomes better than a single steady reading.
Monitoring only works with a reaction plan: For each alarm class, define whether to flag, reject, stop, or call maintenance. Without a plan, operators either ignore alarms or stop the line unnecessarily.
Control vs. Monitoring: Separate the Roles
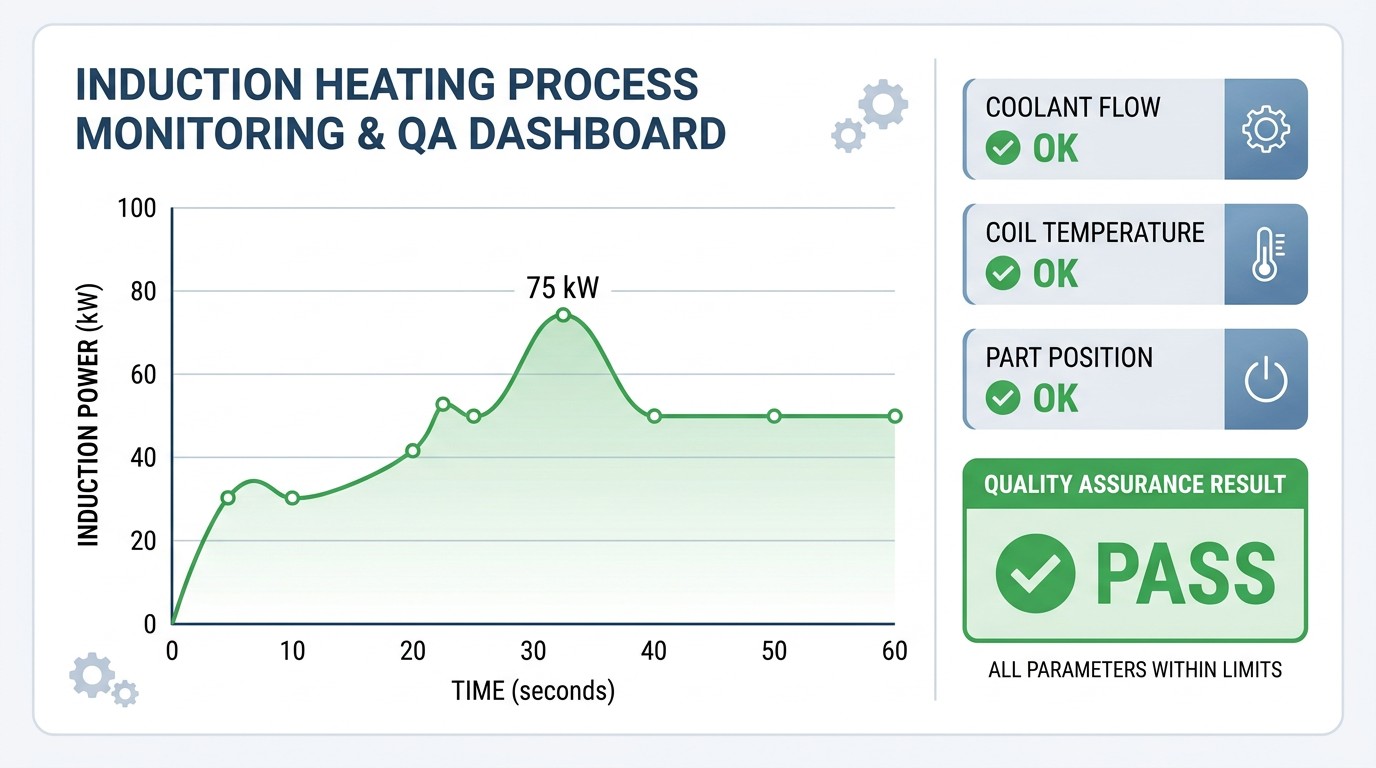
Time-series signatures plus clear pass/fail status.
A control system executes the recipe: timing, motion, power commands, and interlocks. A monitoring system independently verifies what actually happened and whether key variables stayed inside validated limits.
If monitoring simply reuses the controller's internal values, you risk blind spots. Independence is what turns logs into evidence and alarms into actionable signals.
Heat Treating vs. Mass Heating: Different QA Goals
Monitoring and controls context.
Heat treating quality is metallurgical. You care about transformation conditions, hardness gradient, and stress states. Mass heating quality is thermal. You care about exit temperature distribution and gradients that affect forming or coating.
The monitoring strategy must reflect those differences. What you log for a short hardening cycle is not the same as what you log for a continuous billet heater.
Monitor Intermediate Variables That Control Outcomes
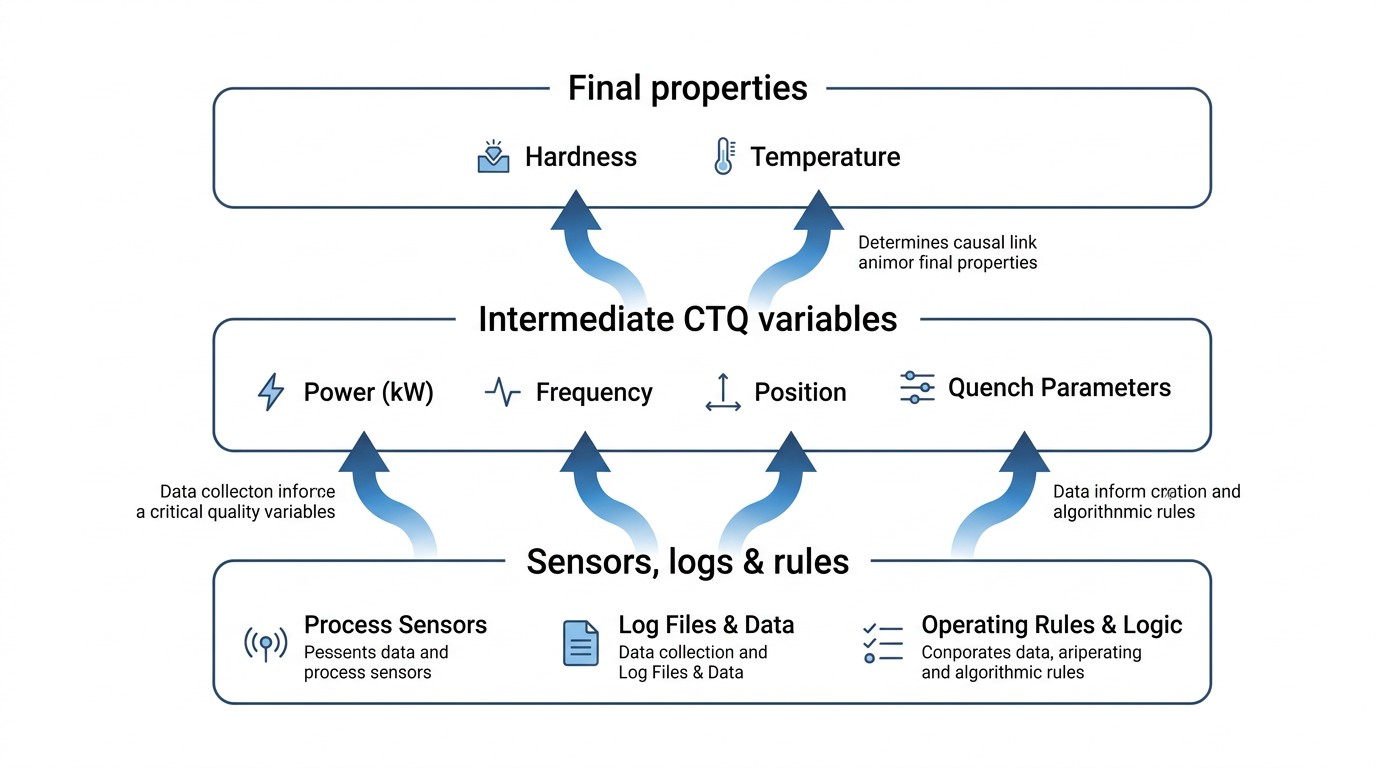
Layered CTQ model linking final properties to measurable intermediate variables.
You generally can't measure fatigue strength inline, but you can measure the variables that strongly influence it. Typical critical variables include delivered kW/kVA, frequency stability, resonance/match indicators, heat time, scan speed, part positioning, quench flow/temperature (for heat treating), and cooling health.
The most effective systems define a validated "good envelope" for these variables and then compare each production cycle to that envelope.
Comparison Table: Monitoring Priorities by Process Type
| Process Type | Primary Quality Target | Monitoring Emphasis |
|---|---|---|
| Heat treating | Microstructure and hardness profile | Timing, power signature, position, quench |
| Mass heating | Temperature distribution | Power by zone, line speed, pyrometry |
| Strip processing | Continuous thermal history | Throughput, power density, environment/cooling |
Acceptance Logic: Windows Beat Single Thresholds
Many cycles are too short for slow meters and too dynamic for single "instant" readings. A robust approach uses interrogation windows: check that a variable stays within a min/max band during the time interval when it matters. This reduces false rejects and makes alarms more diagnostic.
Signature Monitoring: The Most Practical Bridge Between Physics and QA
For short, dynamic cycles, a single number is rarely enough. Signature monitoring stores a time-series "good envelope" for variables like kW, current, voltage, and position. Production cycles are compared against that envelope. Deviations become evidence of drift even before parts fail destructively.
This approach is especially effective for induction because many failure modes create recognizable signature changes: detuning shifts phase indicators, cooling drift shifts current requirements, positioning drift shifts power coupling.
Designing Operator-Facing Monitoring That Gets Used
Operators need clarity, not plots. Provide a simple green/yellow/red view with a clear reaction plan. Engineers need detail for root cause; provide drill-down logs tied to part ID, coil ID, and recipe ID.
When monitoring is designed this way, it reduces downtime rather than creating "data you never use."
A Minimal CTQ Set That Still Works
If you must start small, monitor delivered energy per cycle, frequency plus a match indicator, the motion variable that most affects coupling, and either quench variables (heat treating) or exit temperature (mass heating). This set captures the most common drift mechanisms.
Designing a Reaction Plan: Monitoring Without Action Is Just Data
Monitoring only improves quality if the organization knows what to do with it. For each alarm class, define a reaction plan: continue but flag part, reject part, stop machine, or call maintenance. Without a plan, operators either ignore alarms or stop the line unnecessarily.
A strong system also separates "process out of control" from "instrument out of control." Sensor plausibility checks and redundant indicators reduce false rejects.
Making Logs Useful: Identifiers and Context
Logs become valuable when they are tied to part ID, coil ID, recipe ID, and time stamp. Without that context, you cannot correlate drift to maintenance events or coil replacements. With context, you can do simple analytics that detect drift early.
A Roadmap for Scaling Monitoring
Start with a minimal CTQ set, prove you can use it operationally, then add sensors that close specific blind spots. This approach avoids building an expensive data system that no one trusts.
Closing Implementation Tip: Start with One Station and Prove Value
If you are upgrading monitoring across a factory, begin with one high-value station. Implement identifiers, signature logging, and a reaction plan. Once operators trust the system and maintenance sees fewer surprises, scaling to other stations becomes much easier.
Extending Monitoring Beyond the Power Supply
Many quality escapes originate outside the power supply. Positioning drift, motion timing drift, and quench system drift can change outcomes even when electrical kW looks correct. A robust QA approach includes the non-electrical variables that matter most for the process: position confirmation, motion speed, quench flow/temperature, and incoming part temperature.
The goal is not to measure everything. The goal is to measure the few variables that, when they drift, reliably predict a quality change.
Balancing False Rejects vs. Escapes
A monitoring system that rejects too many good parts will be bypassed. A system that never rejects will allow escapes. The balance is achieved by using windows, signatures, and layered thresholds. A warning tier can trigger maintenance without stopping production; a reject tier removes suspect parts; a stop tier handles unsafe or out-of-control conditions.
When this tiering is designed deliberately, monitoring becomes operationally sustainable.
Final Note: Monitoring Should Reduce Both Scrap and Downtime
The best monitoring systems do not simply reject parts; they detect drift early enough that maintenance can correct the cause before the line produces scrap or trips repeatedly.
Using Monitoring to Reduce Destructive Testing (Responsibly)
In many industries, destructive testing remains required at some cadence, but monitoring can reduce how often parts must be cut by increasing confidence that the process remained inside validated bounds. The key is to validate the correlation between monitored variables and final outcomes.
A practical method is to run a designed validation phase: collect monitoring signatures on a set of parts, then destructively test a statistically meaningful subset. If monitoring variables remain within the envelope and destructive outcomes remain acceptable, you can justify reducing destructive frequency while maintaining risk controls.
This approach also supports traceability. When an issue is found downstream, you can identify whether a part's process signature deviated and whether the deviation correlates with a known failure mode. That capability is often more valuable than the reduction in destructive testing itself.
Finally, monitoring enables faster containment. If a variable drifts out of limits, you can quarantine parts produced during that interval rather than expanding the search to entire shifts. This is where monitoring pays back in real operational cost.
Practical Tip: Calibrate Monitoring Around the Time Window That Matters
For short cycles, focus interrogation on the portion of the cycle where the process is actually controlling outcomes (for example, the heating hold and the quench window). This reduces false alarms and makes monitoring a trusted tool rather than a nuisance.
Common CTQ Drift Signals
A rising current requirement at constant kW often points to worsening coupling or rising connection resistance. A drifting detuning indicator can point to capacitor aging or layout changes. These signals are why time-series logging is so powerful.
Monitoring pays for itself when it shortens containment time. When you can tie a drift event to a narrow time window and a known signature, you prevent both scrap and unnecessary downtime.
Additional note: keep monitoring outputs simple enough that operators act on them, but store enough raw data that engineers can reconstruct events after the fact.
Why Process Control Must Reflect Process Type
The source explicitly contrasts heat treating and mass heating: heat treating often uses frequencies in the range of roughly 6 to 70 kHz (sometimes higher), typically single-frequency except for special cases; mass heating uses much lower frequencies for slabs, bars, and billets, and higher frequencies for strip, sheet, and wire, and it often uses more than one frequency to improve uniformity and efficiency.
This contrast matters because it changes what must be monitored. In heat treating, position control, scan speed, and quench variables can dominate the outcome. In mass heating, line speed, zone power distribution, and thermal loss management dominate. A monitoring system that treats them the same will either miss critical drift or overwhelm operators with irrelevant signals.
Measurement Reality: RMS Accuracy vs. Response Time
The source discusses the limitations of older analog meters and the need for true RMS measurement for non-sinusoidal waveforms, while also noting that some digital meters respond too slowly for short cycles. This trade-off is still present. If your heat time is shorter than your meter response time, you need either faster sampled logging or acceptance logic based on windows rather than single steady readings.
In practice, the best systems provide both: operator-friendly fast indicators and engineer-friendly logged data that can be analyzed after the fact.
Where Monitoring Adds the Most Value: Containment and Traceability
Monitoring is sometimes justified as a way to reduce destructive testing, but its most immediate value is containment. When you have time-stamped signatures and a clear pass/fail envelope, you can isolate suspect production to a narrow time window instead of quarantining entire shifts. That reduces both scrap and investigation workload.
It also improves traceability in multi-station lines. If a downstream problem is found, you can quickly determine whether the upstream induction station showed any signature deviation for that batch, and whether the deviation aligns with known failure modes. This turns QA from reactive to diagnostic.
A Practical Path to "Audit-Friendly" Induction Processes
If you need the process to be audit-friendly, focus on three deliverables: (1) a defined set of critical-to-quality variables, (2) a validated envelope for those variables tied to known-good parts, and (3) an automated record that ties each part (or batch) to its process signature. With those three items, quality discussions become evidence-based, and the monitoring system supports both production and compliance.
Making QA Data Actionable Across Teams
A small but high-impact practice is to standardize terminology across operations, maintenance, and quality: what exactly counts as a warning, a reject, and a stop condition. When teams share the same definitions, monitoring data becomes a shared language rather than a source of confusion.
FAQ about Induction Heating Process Control and Monitoring
Q: What's the minimum monitoring set that still provides real value?
Delivered power/energy per cycle, frequency plus a match indicator, the motion variable that affects coupling most, and quench or exit temperature variables depending on the process.
Q: Why do signature-based approaches outperform single-threshold checks?
Because they capture dynamic behavior: ramps, holds, and transient events that correlate with quality outcomes better than a single steady reading.
Q: How do you prevent monitoring from becoming "data you never use"?
Give operators clear status and actionable alarms, and give engineers detailed logs tied to part/coil/recipe IDs. Without identifiers and reaction plans, data loses operational value.
Conclusion: Induction Heating Process Control and Monitoring
An induction process becomes auditable and robust when control executes the recipe and independent monitoring verifies critical variables stayed within a validated envelope. That is how you reduce destructive testing frequency while increasing confidence. Quality is achieved by physics and proven by data.
Keep Learning
Induction Billet Heating: How to Achieve Uniform Heating
Induction billet heating prepares metal for forging, extrusion, or rolling by generating heat inside the workpiece. For steel billets, reaching the required exit temperature is only part of the task: the temperature distribution from surface to core and along the billet must also suit the forming process. Uniformity depends on how frequency, coil geometry, heat transfer, power distribution, and billet movement work together. This guide focuses on through-heating steel billets, particularly in progress......
How to Upgrade a 3D Printer Heated Bed with a Silicone Heater
If your 3D printer heated bed takes too long to reach temperature, develops uneven heating, or struggles to maintain a stable surface temperature, a silicone heater can be a practical upgrade. Faster warm-up and more uniform heat can improve first-layer consistency and reduce temperature-related printing issues. This guide explains how to identify when a heated-bed upgrade is needed, choose a suitable silicone heater, install it safely, and verify the results. Quick Answer A silicone heater can be a s......
How Graphene and MXene Flake Sensors Detect Force
Key Takeaways Flake networks sense force through microstructural change: Graphene and MXene coatings distribute conduction across overlapping platelets whose contacts shift under stretch or pressure, producing measurable resistance changes. Three mechanisms compete: Crack propagation, flake slippage, and quantum tunnelling each dominate at different deformation levels, giving many sensors multiple sensitivity regions rather than one uniform response. The substrate is an active partner: Elastomers, tex......
Conductive 2D Coatings Are a Matching Problem, Not a Miracle Ink
Key Takeaways Ink is a system, not a material: Conductivity depends on the combined effect of flake chemistry, solvent, additives, substrate, coating method, and post-processing—not on the 2D filler alone. Three carbon routes carry different trade-offs: GNPs demand dispersion engineering, GO shifts effort to a reduction step, and MXenes move the bottleneck to synthesis, storage, and oxidation control. Substrate geometry drives method selection: Spray and blade coating suit flat sheets; dip coating nat......
Graphene Heat Spreader Design: Layers and Interfaces
Key Takeaways Conductivity alone is not enough: A record thermal-conductivity value does not guarantee a cooler chip. Effective thickness, interface resistance, hot-spot geometry, and heat-sink connections all belong to the same thermal path. Few-layer graphene can outperform a single layer in practice: A few-layer sheet provides a larger heat-flow cross section and better tolerates transfer, embedding, and defects, even though its intrinsic conductivity is lower. Interface resistance is the bottlenec......
How Graphene Heat Spreaders Cool SOI Chip Hot Spots
Key Takeaways Buried oxide is a thermal bottleneck: SOI's insulating layer improves electrical isolation but traps heat near transistor channels, creating dangerous hot spots that package-level cooling alone cannot fix. Graphene enables lateral heat routing: Placing graphene or few-layer graphene beneath the buried oxide adds a high-conductivity sideways path, redistributing hot-spot energy toward dedicated sinks without removing any heat itself. Multi-source chips benefit most: Finite-element modelin......